
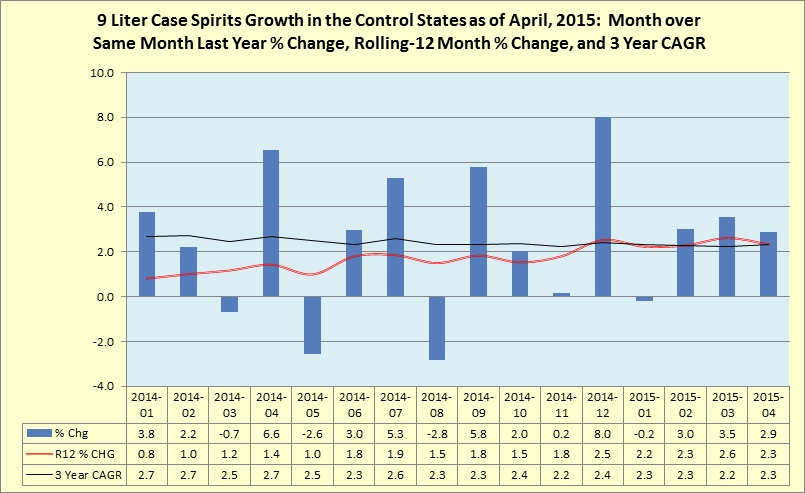
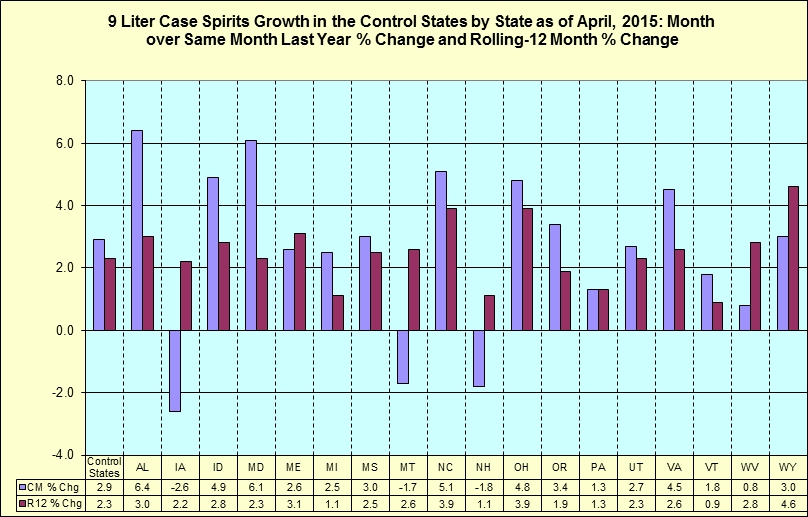
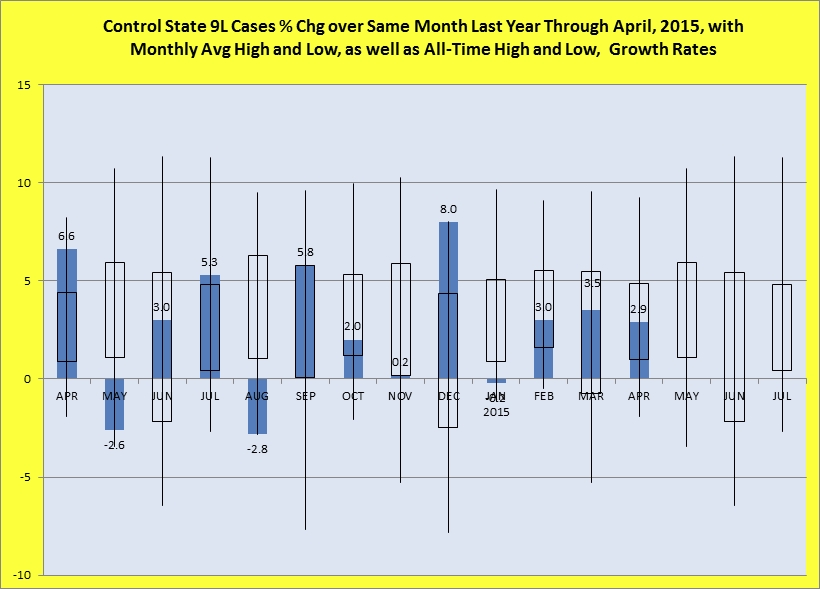
ALEXANDRIA, VA (May 20, 2015)-- During April, nine-liter spirits case sales in the control states grew at 2.9%, in spite of a tough comp, compared to same period sales last year. Rolling-twelve month volume growth, 2.3%, slipped from March’s 2.6%. Alabama, Idaho, Montgomery County Maryland, Michigan, Mississippi, North Carolina, Ohio, Oregon, Pennsylvania, Utah, Virginia, and Vermont reported monthly growth rates exceeding their twelve month trends. Year-to-Date nine-liter spirits case sales are up 2.3%.
Of note during March and April, Michigan’s share of the control states spirits market, as measured using rolling-12 month 9-liter case totals, has surpassed Pennsylvania’s. During March the difference was a fraction of a basis point; during April the difference was two basis points.
Control state spirits shelf dollars were up 6.0% during April while trending at 5.0% during the past twelve months. Alabama, Idaho, Montgomery County Maryland, Maine, Michigan, Mississippi, North Carolina, Ohio, Oregon, Utah, Virginia, Vermont, and West Virginia reported growth rates exceeding their twelve month trends. Year-to-date shelf dollars have grown 5.1%.
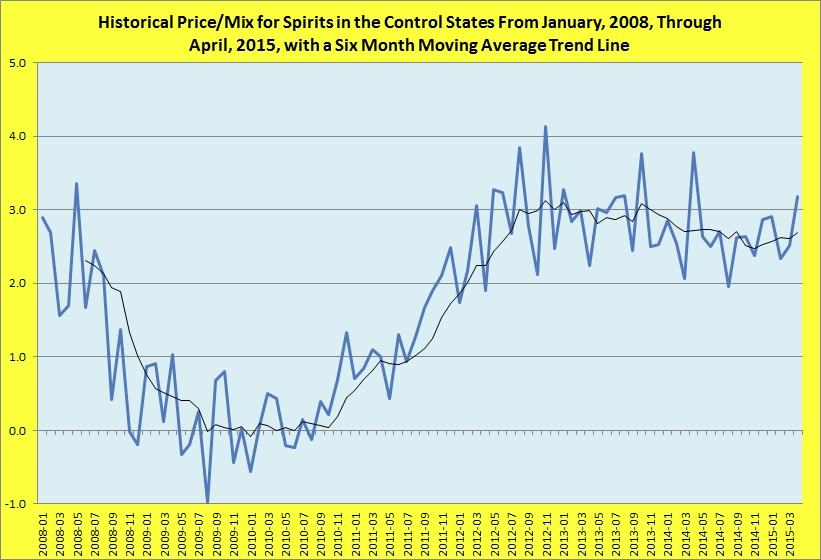
Price/Mix for April is 3.1%, improving on March’s 2.6%.
During April, Irish Whiskey, with 1.0% share of the control states spirits market, was the fastest growing category with 13.5% reported and a twelve month trend of 12.3%. Vodka, with 35% share, grew during the same periods at 2.2% and 2.0%. Canadian Whiskey, Cocktails, Domestic Whiskey, Gin, Irish Whiskey, Rum, Scotch, Tequila, and Vodka grew at rates exceeding their twelve-month trends.
April’s nine-liter wine case sales growth rate was -0.5%. Pennsylvania, New Hampshire, Utah, Mississippi, Montgomery County Maryland, and Wyoming reported -0.4%, -3.9%, 4.0%, -1.2%, 2.8%, and 5.4%, respectively. Rolling-twelve month wine volume growth was 1.4%, down from March’s 2.2%.
| 9L Cases CM % Chg | Shelf $ CM % Chg | Price/Mix | Control States | |
|---|---|---|---|---|
| Total Control States | 2.9 | 6.0 | 3.1! | |
| Central Region | 2.2 | 5.2 | 3.0% | IA, MD, MI, OH, PA, WV |
| NE Region | -0.3 | 1.2 | 1.5% | ME, NH, VT |
| NW Region | 2.8 | 5.8 | 3.0% | ID, MT, OR, UT, WY |
| Southern Region | 4.8 | 8.8 | 4.0% | AL, MS, NC, VA |
For more information about the NABCA, visit www.nabca.org.
###
ABOUT NABCA:
Established in 1938, NABCA is the national association representing the Control State Systems - those jurisdictions that directly control the distribution and sale of beverage alcohol within their borders. Headquartered in Alexandria, VA, NABCA’s mission is to support member jurisdictions in their efforts to protect public health and safety and assure responsible and efficient systems for beverage alcohol distribution and sales.